Force Directed Graphs
Force directed graphs enable interesting visualizations
 A graph of the relationships in Les Misérables
Recently, I came across a graph. This particular graph caught my attention because it was a graphical representation of book characters – not your typical graph! Since I enjoy reading, math, and computer science, this graph interested me greatly. This article is a breakdown of some of the interesting uses of Force Directed Illustration. I hope you can gain some insight!
Jump to the bottom if you just want to see the Les Misérables graphs!
What is a Force Directed Illustration?
A Force Directed Illustration is a visualization of data in a way that it shows both the relationship between data and weight with which those elements are connected. Essentially, data is shown relationally. The graph shows not only the fact that data are connected but also how strong the relationships formed are.
How can a Force Directed Illustration be used?
According to yWorks, a data visualization solution, Force Directed Graphs can be used in a number of fields.
Force-directed graph layouts are commonly used in the following application areas: network visualization, large graph visualization, knowledge representation, system management, and mesh visualization.
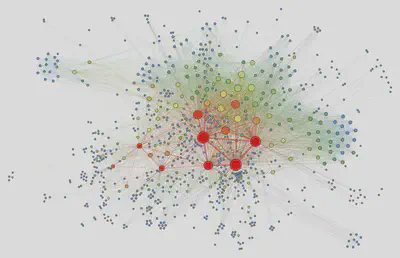
In the image above, we see the distribution of social relations graphed out. The data for this graph was after the partial analysis of several thousand documents. According to the study
The edges thicken in proportion to the number of simultaneous appearances of people as actors of the same document.
This graph is a little hard to understand because it simply contains WAAY too much detail to understand. Let’s go back to where I started and look at a graph that is more simple.
Les Misérables in a graph!
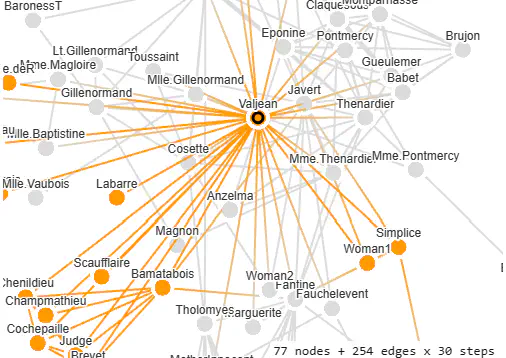
See the Pen ElGrapho Miserables Force Directed Graph by Gavin S. (@blue2cat) on CodePen.
The graph above is interactive – you can try zooming in and clicking on people with the controls at the top.
The graph is organized so that each character is organized into a group. Each different person is linked to other people which are related. This graph does not show the intricacies of relationship weight well. The image below does a better job in that department.
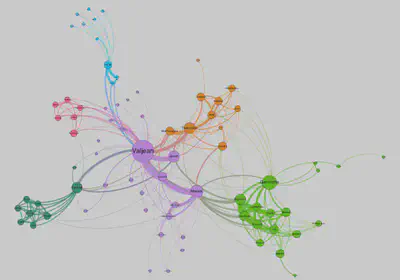
As you can see, this style of illustration does a good job of illustrating the main character and seeing how that character relates to others.
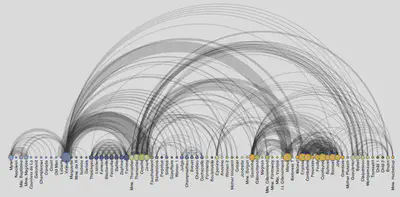
What to see a map of how characters interact? These two graphs are a little complex, but are good for purposes of illustration. Note that the first graph is a radial diagram.
Anyway, that’s all I have for today. If you want to look into Force Directed Graphs, I recommend starting at this page: yWorks - Force-Directed Graph Layout.
If you want to see some really cool graphs from other books, check out this site:
Middle-earth in Numbers - LotrProject
This site has lots of fun details about the Lord of the Rings, by JRR Tolkien.
Note: A force-directed graph drawing algorithm is also also known as a spring-embedder or energy-based placement algorithm.
Resources:
- Introduction to data visualization: network analysis in history (French) - MARTIN GRANDJEAN
- Force-Directed Drawing Algorithms - Stephen G. Kobourov
- A Numerical Optimization Approach to General Graph Drawing – Daniel Tunkelang
- yWorks - Force-Directed Graph Layout
- Force-directed graph drawing - Wikipedia
- LES MISÉRABLES CHARACTER NETWORK VISUALIZATION